Testing script on simulation Sim5
Line-fitting tests on Sim5 simulation
dataset from M. Moresco (see README.dat).
The dataset is reorganized the following way:
Sim5/
+-- Data/
|   +-- s-1-0.dat.bz2
|   +-- [...]
+-- input.dat
+-- README.dat
and is pointed to by the environment variable SIM5PATH=/path/to/Sim5/.
1 2 3 4 5 6 7 8 9 10 11 12 13 14 15 16 17 18 19 20 21 22 23 24 25 26 27 28 29 30 31 32 33 34 35 36 37 38 39 40 41 42 43 44 45 46 47 48 49 50 51 52 53 54 55 56 57 58 59 60 61 62 63 64 65 66 67 68 69 70 71 72 73 74 75 76 77 78 79 80 81 82 83 84 85 86 87 88 89 90 91 92 93 94 95 96 97 98 99 100 101 102 103 104 105 106 107 108 109 110 111 112 113 114 115 116 117 118 119 120 121 122 123 124 125 126 127 128 129 130 131 132 133 134 135 136 137 138 139 140 141 142 143 144 145 146 147 148 149 150 151 152 153 154 155 156 157 158 159 160 161 162 163 164 165 166 167 168 169 170 171 172 173 174 175 176 177 178 179 180 181 182 183 184 185 186 187 188 189 190 191 192 193 194 195 196 197 198 199 200 201 202 203 204 205 206 207 208 209 210 211 212 213 214 215 216 217 218 219 220 221 222 223 224 225 226 227 228 229 230 231 232 233 234 235 236 237 238 239 240 241 242 243 244 245 246 247 248 249 250 251 252 253 254 255 256 257 258 259 260 261 262 263 264 265 266 267 268 269 270 271 272 273 274 275 276 277 278 279 280 281 282 283 284 285 286 287 288 289 290 291 292 293 294 295 296 297 298 299 300 301 302 303 304 305 306 307 308 309 310 311 312 313 314 315 316 317 318 319 320 321 322 323 324 325 326 327 328 329 330 331 332 333 334 335 336 337 338 339 340 341 342 343 344 345 346 347 348 349 350 351 352 353 354 355 356 357 358 359 360 361 362 363 364 365 366 367 368 369 370 371 372 373 374 375 376 377 378 379 380 381 382 383 384 385 386 387 388 389 390 391 392 393 394 395 396 397 398 399 400 401 402 403 404 405 406 407 408 409 410 411 412 413 414 415 416 417 418 419 420 421 422 423 424 425 426 427 428 429 430 431 432 433 434 435 436 437 438 439 440 441 442 443 444 445 446 447 448 449 450 451 452 453 454 455 456 457 458 459 460 461 462 463 464 465 466 467 468 469 470 471 472 473 474 475 476 477 478 479 480 481 482 483 484 485 486 487 488 489 490 491 492 493 494 495 496 497 498 499 500 501 502 503 504 505 506 507 508 509 510 511 512 513 514 515 516 517 518 519 520 521 522 523 524 525 526 527 528 529 530 531 532 533 534 535 536 537 538 539 540 541 542 543 544 545 546 547 548 549 550 551 552 553 554 555 556 557 558 559 560 561 562 563 564 565 566 567 568 569 570 571 572 573 574 575 576 577 578 579 580 581 582 583 584 585 586 587 588 589 590 591 592 593 594 595 596 597 598 599 600 | #!/usr/bin/env python
# -*- coding: utf-8 -*-
# Time-stamp: <2018-11-08 12:04 ycopin@lyonovae03.in2p3.fr>
from __future__ import division, print_function
__author__ = "Yannick Copin <y.copin@ipnl.in2p3.fr>"
import os
import time
import numpy as N
import matplotlib.pyplot as P
import astropy.modeling as AM
import astropy.table as AT
import inspec.spectrum as IS
import inspec.lines as IL
from inspec import mpl
SQRT2PI = 2.5066282746310002
CLIGHT = 299792.458 # [km/s]
MAXITER = 1000 # Maximum number of iterations
def read_spec(filename):
"""
Read `Sim5` spectrum *filename* (handle compression on the fly).
"""
xyv = N.loadtxt(filename) # Handle compressed files
name = os.path.basename(filename)
while '.' in name: # Remove *all* extensions
name, _ = os.path.splitext(name)
return IS.Spectrum.from_vecs(xyv[:, 0], xyv[:, 1],
v=xyv[:, 2]**2, name=name)
def select_sample(pattern, path='.', nspec=0):
"""
Select (a sample of *nspec*) filenames from *pattern* relative to *path*.
"""
from glob import glob
filenames = glob(os.path.join(path, pattern))
if nspec:
from random import sample
filenames = sample(filenames, nspec)
return filenames
def fig_sample(filenames):
"""
Generate an overview figure of spectra read from *filenames*.
"""
fig = P.figure()
ax = fig.add_subplot(1, 1, 1,
xlabel=u"Wavelength [Å]",
ylabel="Flux + cte")
for i, filename in enumerate(filenames, start=1):
print("Spectrum #{}/{}: {}".format(i, nspec, filename))
spec = read_spec(filename)
spec.y += i
spec.plot(ax, errorband=False, color='0.5')
ax.annotate(spec.name, (spec.start, i))
ax.set_xlim(spec.start - 100, spec.end + 100)
ax.set_ylim(0, nspec + 1)
return fig
def fit_sample(model, fitter, filenames, tied_params=None):
"""
Fit generic model over spectra.
:param astropy.modeling.Model model: generic model
:param astropy.modeling.fitting.Fitter fitter: generic fitter
:param list filenames: spectra to be fit
:param list tied_params: tied parameter indices
:return: fit result
:rtype: :class:`astropy.table.Table`
"""
nparam = len(model.parameters)
colnames = ['ID', 'ierr']
colnames += list(model.param_names) # Parameters
colnames += list( param + '_err' for param in model.param_names ) # Errors
colnames += list( param1 + '_' + param2 + '_corr'
for i, param1 in enumerate(model.param_names)
for param2 in model.param_names[i + 1:] ) # Correlation
dtype = ['S12', 'i'] # ID & ierr
dtype += ['f8'] * (nparam * 2) # param + dparams
dtype += ['f8'] * int(nparam * (nparam - 1) / 2) # param correlations
table = AT.Table(names=colnames, dtype=dtype)
for i, filename in enumerate(filenames, start=1):
spec = read_spec(filename)
print("Spectrum #{}/{}: {}".format(i, len(filenames), spec.name))
fit = fitter(model, spec.x, spec.y, weights=1/spec.v, maxiter=MAXITER)
ierr = fitter.fit_info['ierr']
# Success = Converged fit + Covariance matrix + Diag. elements >= 0
success = ((ierr <= 4) and
(fitter.fit_info['param_cov'] is not None) and
(N.diagonal(fitter.fit_info['param_cov']) >= 0).all())
if success:
# Adjusted parameters
params = fit.parameters
# Covariance matrix
param_cov = fitter.fit_info['param_cov']
if tied_params is not None: # Restore missing col/row
for itied in sorted(tied_params):
param_cov = N.insert(param_cov, itied, 0, axis=0) # row
param_cov = N.insert(param_cov, itied, 0, axis=1) # col
# Error on parameters
dparams = N.sqrt(N.diagonal(param_cov))
# Correlation matrix
param_corr = param_cov / N.outer(dparams, dparams)
if tied_params is not None: # Restore missing col/row
for itied in sorted(tied_params):
param_corr[itied] = 0
param_corr[:, itied] = 0
# Correlation on parameters
cparams = [ param_corr[i, j]
for i in range(nparam)
for j in range(i + 1, nparam) ]
else: # Failure
params = dparams = [0] * nparam
cparams = [0] * int(nparam * (nparam - 1) / 2)
# Add row
table.add_row([spec.name, ierr] +
list(params) + list(dparams) + cparams)
return table
def print_stats(arr, darr, names=None, label='anonymous array'):
from inspec.statistics import rms
if names is None:
names = N.arange(arr.size)
print("""{}: {} elements
Mean: {:+8.5f} Median: {:+8.5f}
RMS: {:+8.5f} wRMS: {:+8.5f}
Min: {:+8.5f} for {}
Max: {:+8.5f} for {}
""".format(label, arr.size,
arr.mean(), N.median(arr),
rms(arr), rms(arr, weights=darr**-2),
arr.min(), names[arr.argmin()],
arr.max(), names[arr.argmax()]))
def postproc_table_1line(table,
ref_z=1.5,
ref_Ha=6562.8,
ref_sig=13.,
ref_c0=2e-18):
"""
Post-processing of single-line merged input+output table.
Compute additional columns:
* redshift offset dz = mean_0 / ref_Ha - 1 - ref_z
* integrated line flux = amplitude_0 * stddev_0 * SQRT2PI * 1e-17
(error properly include correlation between line amplitude and stddev)
* relative flux error fratio = flux / F_Ha - 1
Failed rows have null values and errors.
"""
failed = table['mean_0'] == 0
# Redshift offset
dz = table['mean_0'] / ref_Ha - 1 - ref_z
dz[failed] = 0
dz_err = table['mean_0_err'] / ref_Ha
dz_err[failed] = 0
table.add_columns([AT.Column(name="dz", data=dz),
AT.Column(name="dz_err", data=dz_err)])
# Integrated line flux (error includes correlation between parameters)
flux = table['amplitude_0'] * table['stddev_0'] * SQRT2PI * 1e-17
flux_err = SQRT2PI * 1e-17 * N.sqrt(
(table['amplitude_0'] * table['stddev_0_err'])**2 +
(table['amplitude_0_err'] * table['stddev_0'])**2 +
2 * table['amplitude_0'] * table['stddev_0'] *
table['amplitude_0_stddev_0_corr'] *
table['amplitude_0_err'] * table['stddev_0_err'])
table.add_columns([AT.Column(name="flux", data=flux),
AT.Column(name="flux_err", data=flux_err)])
# Flux relative error
fratio = table['flux'] / table['F_Ha'] - 1
fratio[failed] = 0
fratio_err = table['flux_err'] / table['F_Ha']
fratio_err[failed] = 0
table.add_columns([AT.Column(name="fratio", data=fratio),
AT.Column(name="fratio_err", data=fratio_err)])
return table
def postproc_table_3lines(table,
ref_z=1.5,
ref_Ha=6562.8,
ref_sig=13.,
ref_c0=2e-18):
"""
Post-processing of complex-line merged input+output table.
Compute additional columns:
* redshift offset dz = wHa_0 / ref_Ha - 1 - ref_z
* integrated Ha line fHa = iHa_0 * sigma_0 * SQRT2PI * 1e-17
(error properly include correlation between line amplitude and stddev)
* relative flux error fratio = fHa / F_Ha - 1
Failed rows have null values and errors.
"""
failed = table['wHa_0'] == 0
# Redshift offset
dz = table['wHa_0'] / ref_Ha - 1 - ref_z
dz[failed] = 0
dz_err = table['wHa_0_err'] / ref_Ha
dz_err[failed] = 0
table.add_columns([AT.Column(name="dz", data=dz),
AT.Column(name="dz_err", data=dz_err)])
# Integrated Ha line flux (error includes correlation between parameters)
flux = table['iHa_0'] * table['sigma_0'] * SQRT2PI * 1e-17
flux_err = SQRT2PI * 1e-17 * N.sqrt(
(table['iHa_0'] * table['sigma_0_err'])**2 +
(table['iHa_0_err'] * table['sigma_0'])**2 +
2 * table['iHa_0'] * table['sigma_0'] *
table['iHa_0_sigma_0_corr'] *
table['iHa_0_err'] * table['sigma_0_err'])
table.add_columns([AT.Column(name="fHa", data=flux),
AT.Column(name="fHa_err", data=flux_err)])
# Flux relative error
fratio = table['fHa'] / table['F_Ha'] - 1
fratio[failed] = 0
fratio_err = table['fHa_err'] / table['F_Ha']
fratio_err[failed] = 0
table.add_columns([AT.Column(name="fratio", data=fratio),
AT.Column(name="fratio_err", data=fratio_err)])
return table
def fig_result(table, failed):
"""
Result figure for post-processed result table.
"""
fig = P.figure()
ax1 = fig.add_subplot(2, 1, 1,
xscale='log',
ylabel=u"Redshift offset",
title="Fail rate: {}/{} = {:.2f}%"
.format(len(table[failed]), len(table),
len(table[failed]) / len(table) * 1e2))
fac = 1e17
ax1.plot(table['F_Ha'][~failed] * fac,
table['dz'][~failed], marker='.', ls='none', c=mpl.blue)
ax1.plot(table['F_Ha'][failed] * fac,
table['dz'][failed], marker='.', ls='none', c=mpl.red)
ax1.autoscale(False) # Don't auto-scale view to accomodate error bars
ax1.errorbar(table['F_Ha'][~failed] * fac, table['dz'][~failed],
yerr=table['dz_err'][~failed],
fmt='none', ecolor='0.8', zorder=-1)
ax2 = fig.add_subplot(2, 1, 2,
xlabel=u"Input Hα flux [×1e17]",
ylabel=u"Hα flux relative error",
sharex=ax1)
ax2.plot(table['F_Ha'][~failed] * fac,
table['fratio'][~failed], marker='.', ls='none', c=mpl.blue)
ax2.plot(table['F_Ha'][failed] * fac,
table['fratio_err'][failed], marker='.', ls='none', c=mpl.red)
ax2.autoscale(False)
ax2.errorbar(table['F_Ha'][~failed] * fac, table['fratio'][~failed],
yerr=table['fratio_err'][~failed],
fmt='none', ecolor='0.8', zorder=-1)
# Fine-tune the (shared) x-axis
ax2.set_xlim(table['F_Ha'].min()*fac/1.1, table['F_Ha'].max()*fac*1.1)
ax2.xaxis.set_major_formatter(P.matplotlib.ticker.ScalarFormatter())
ax2.xaxis.set_major_locator(P.matplotlib.ticker.AutoLocator())
ax2.xaxis.set_minor_locator(P.matplotlib.ticker.AutoMinorLocator())
return fig
if __name__ == '__main__':
sim5path = os.getenv('SIM5PATH', '.')
print("Sim5 path:", sim5path)
ref_z = 1.5 # Reference redshift
ref_Ha = 6562.8 # Restframe wavelength [A]
ref_sig = 13.0 # Restframe dispersion [A]
ref_c0 = 2e-18 # Reference background [flambda]
max_sig = 5 * ref_sig # Maximum stddev [A]
force_pos = True # Bound the emission line intensity to positive value
tie_NIIHa = True # Tie the [NII] amplitude to the Ha one
# Input table
inname = os.path.join(sim5path, "input.dat")
intbl = AT.Table.read(inname, format="ascii")
filename = "Data/s-2-920.dat.bz2"
filename = "Data/s-1-2129.dat.bz2" # Low S/N (fail)
filename = "Data/s-1-1300.dat.bz2" # Fail
filename = "Data/s-1-2067.dat.bz2" # Fail
filename = "Data/s-1-413.dat.bz2" # Low S/N (success)
filename = "Data/s-1-2123.dat.bz2" # Negative amplitude
filename = "Data/s-1-1958.dat.bz2" # High offset
filename = "Data/s-1-4283.dat.bz2" # High S/N
filename = "Data/s-1-813.dat.bz2" # Excessive amplitude/stddev
filename = "Data/s-1-1824.dat.bz2" # High offset
filename = "Data/s-1-1843.dat.bz2" # High offset
filename = "Data/s-1-2204.dat.bz2"
filename = "Data/s-2-2054.dat.bz2"
filename = "Data/s-2-785.dat.bz2"
filename = "Data/s-2-3293.dat.bz2" # Highest F_Ha fail
filename = "Data/s-2-3030.dat.bz2"
filename = "Data/s-1-2027.dat.bz2" # Highest SNR_Ha fail
filename = "Data/s-1-840.dat.bz2" # Highest F_Ha fail
filename = "Data/s-2-2167.dat.bz2"
spec = read_spec(os.path.join(sim5path, filename))
print(spec)
ax = spec.plot(errorband=True, color='0.5')
ax.set_xlim(spec.start - 100, spec.end + 100)
ax.set_title(spec.name)
# Input line
ax.axvline(ref_Ha * (1 + ref_z), ls=':', color='k')
sel = intbl['ID'] == spec.name
f0 = intbl['F_Ha'][sel].data[0] # Input flux
g = IL.GaussianNormed1D(flux=f0,
mean=ref_Ha * (1 + ref_z),
stddev=ref_sig * (1 + ref_z))
ax.plot(spec.x, (g(spec.x) + ref_c0) / 1e-17, ls=':', color='k')
if False: # Automatic detection
cont, lines = IS.fit_adaptive(spec, dmax=0, nmax=1, verbose=True)
fit_Ha = lines.mean.value
fit_z = (fit_Ha - ref_Ha) / ref_Ha
dz = fit_z - ref_z
ax.plot(spec.x, cont(spec.x) + lines(spec.x), ls='--', color='k')
ax.set_title(ax.get_title() + " - dz = {:g}".format(dz))
# Single-line fit: [0] Gaussian1D + [1] constant
Ha = AM.models.Gaussian1D(mean=ref_Ha * (1 + ref_z),
amplitude=1, stddev=30) # Single Gaussian1D
if force_pos:
print("WARNING: force emission line amplitude positivity")
Ha.bounds['amplitude'] = (0, None) # Positivity
Ha.bounds['stddev'] = (0, max_sig * (1 + ref_z))
Ha += AM.polynomial.Legendre1D(0) # Constant background
# Generic fitter
fitter = AM.fitting.LevMarLSQFitter()
ha = fitter(Ha, spec.x, spec.y, weights=1/spec.v, maxiter=MAXITER)
print(ha)
ierr = fitter.fit_info['ierr']
# Success = Converged fit + Covariance matrix + Diag. elements >= 0
success = ((ierr <= 4) and
(fitter.fit_info['param_cov'] is not None) and
(N.diagonal(fitter.fit_info['param_cov']) >= 0).all())
if success: # Success
# Adjusted parameters
params = ha.parameters # amplitude_0, mean_0, stddev_0, c0_1
# Adjusted parameter covariance matrix
param_cov = fitter.fit_info['param_cov']
dparams = N.sqrt(N.diagonal(param_cov))
corr = param_cov / N.outer(dparams, dparams)
# Redshift offset
dz = ha[0].mean / ref_Ha - 1 - ref_z
ddz = dparams[1] / ref_Ha
print("{}: redshift offset = {} ± {}"
.format(spec.name, dz, ddz))
ax.plot(spec.x, ha(spec.x), color=mpl.blue, lw=2)
ax.set_title(ax.get_title() +
u" - dz1 = {:.3g} ± {:.2g}".format(dz, ddz))
# Flux error
f = ha[0].amplitude * ha[0].stddev * SQRT2PI # Output flux
df = SQRT2PI * N.sqrt(
(ha[0].amplitude * dparams[2])**2 +
(dparams[0] * ha[0].stddev)**2 +
2 * ha[0].amplitude * ha[0].stddev *
corr[0, 2] * dparams[0] * dparams[2])
print("{}: flux = {} ± {} (input = {})"
.format(spec.name, f, df, f0 / 1e-17))
else: # Fail
print("{}: error #{} while fitting single line (msg: {})"
.format(spec.name, ierr, fitter.fit_info['message']))
ax.plot(spec.x, ha(spec.x), ls='--', color=mpl.red, lw=2)
# Complex-line fit: [0] IL.ComplexHa + [1] constant
NIIHa = IL.ComplexHa(wHa=ref_Ha * (1 + ref_z),
iHa=1, iNII=1/2.25, sigma=30) # [NII] + Ha complex
if force_pos:
print("WARNING: force emission line amplitude positivity")
NIIHa.bounds['iHa'] = (0, None) # Positivity
NIIHa.bounds['iNII'] = (0, None) # Positivity
NIIHa.bounds['sigma'] = (0, max_sig * (1 + ref_z))
NIIHa += AM.polynomial.Legendre1D(0) # Constant background
if tie_NIIHa:
print("WARNING: adding constraint 3/4 iNII = 1/3 iHa")
NIIHa[0].iNII.tied = lambda line: line[0].iHa / 2.25 # 3/4 iNII = 1/3 iHa
tied_params = (2,)
else:
tied_params = None
niiha = fitter(NIIHa, spec.x, spec.y, weights=1/spec.v, maxiter=MAXITER)
print(niiha)
ierr = fitter.fit_info['ierr']
# Success = Converged fit + Covariance matrix + Diag. elements >= 0
success = ((ierr <= 4) and
(fitter.fit_info['param_cov'] is not None) and
(N.diagonal(fitter.fit_info['param_cov']) >= 0).all())
if success: # Success
# Adjusted parameters
params = niiha.parameters # wHa_0, iHa_0, iNII_0, sigma_0, c0_1
# Adjusted parameter covariance matrix
param_cov = fitter.fit_info['param_cov'] # Fractional covariance
dparams = N.sqrt(N.diagonal(param_cov))
corr = param_cov / N.outer(dparams, dparams)
# Redshift offset
dz = niiha[0].wHa / ref_Ha - 1 - ref_z
ddz = dparams[1] / ref_Ha
print("{}: redshift offset = {} ± {}"
.format(spec.name, dz, ddz))
ax.plot(spec.x, niiha(spec.x), color=mpl.green, lw=2)
ax.plot(spec.x,
NIIHa[0].Ha_line(spec.x, *niiha[0].parameters) +
niiha[1](spec.x),
color=mpl.green, ls='--')
ax.plot(spec.x,
NIIHa[0].NII_lines(spec.x, *niiha[0].parameters) +
niiha[1](spec.x),
color=mpl.green, ls='--')
ax.set_title(ax.get_title() +
u" - dz3 = {:.3g} ± {:.2g}".format(dz, ddz))
# Ha flux error
f = niiha[0].iHa * niiha[0].sigma * SQRT2PI
df = SQRT2PI * N.sqrt(
(niiha[0].iHa * dparams[3])**2 +
(dparams[1] * niiha[0].sigma)**2 +
2 * niiha[0].iHa * niiha[0].sigma *
corr[1, 3] * dparams[1] * dparams[3])
print("{}: flux = {} ± {} (input = {})"
.format(spec.name, f, df, f0 / 1e-17))
else: # Fail
print("{}: error #{} while fitting complex line (msg: {})"
.format(spec.name, ierr, fitter.fit_info['message']))
ax.plot(spec.x, niiha(spec.x), ls='--', color=mpl.purple, lw=2)
if False: # Work on restricted sample
nspec = 30
filenames = select_sample("Data/s-2-*.dat.bz2", path=sim5path, nspec=nspec)
fig = fig_sample(filenames)
fig.axes[0].axvline(ref_Ha * (1 + ref_z), ls=':', color='k')
fig.set_size_inches(8, 12, forward=True)
fig.tight_layout()
# table = fit_sample(Ha, fitter, filenames)
table = fit_sample(NIIHa, fitter, filenames)
print(table)
# Single line ==================================================
print(" Single line ".center(70, '='))
outname = "output-s-1.dat" # Single-line fit
if False: # Work on full sample
filenames = select_sample("Data/s-1-*.dat.bz2", path=sim5path)
tstart = time.time()
table = fit_sample(Ha, fitter, filenames)
tend = time.time()
print("Time to fit {} spectra: {:1f} s = {:.2f} ms/spec"
.format(len(filenames), tend - tstart,
(tend - tstart) / len(filenames) * 1e3))
table.write(outname, format='ascii.commented_header')
print("Fit result saved in {}".format(outname))
# Fit table
outtbl = AT.Table.read(outname, format="ascii")
# Merge input and output table on ID key
table = AT.join(intbl, outtbl, keys='ID')
table = postproc_table_1line(table,
ref_z=ref_z,
ref_Ha=ref_Ha,
ref_sig=ref_sig,
ref_c0=ref_c0)
# Some statistics
failed = table['mean_0'] == 0 # | ~N.isfinite(table['mean_0_err'])
print("Fail rate: {}/{} = {:.2f}%"
.format(len(table[failed]), len(table),
len(table[failed])/len(table)*1e2))
# table[failed].show_in_browser(jsviewer=True)
print_stats(table['dz'][~failed], table['dz_err'][~failed],
names=table['ID'][~failed], label="Redshift offset")
print_stats(table['fratio'][~failed], table['fratio_err'][~failed],
names=table['ID'][~failed], label="Flux error")
# Single-line fit result figure
fig = fig_result(table, failed)
fig.suptitle("Single line")
# Complex line ==================================================
print(" Complex line ".center(70, '='))
if tie_NIIHa:
outname = "output-s-2_tied.dat" # Complex-line fit, constrained
else:
outname = "output-s-2.dat" # Complex-line fit
if False: # Work on full sample
filenames = select_sample("Data/s-2-*.dat.bz2", path=sim5path)
tstart = time.time()
table = fit_sample(NIIHa, fitter, filenames, tied_params=tied_params)
tend = time.time()
print("Time to fit {} spectra: {:1f} s = {:.2f} ms/spec"
.format(len(filenames), tend - tstart,
(tend - tstart) / len(filenames) * 1e3))
table.write(outname, format='ascii.commented_header')
print("Fit result saved in {}".format(outname))
# Fit table
outtbl = AT.Table.read(outname, format="ascii")
# Merge input and output table on ID key
table = AT.join(intbl, outtbl, keys='ID')
table = postproc_table_3lines(table,
ref_z=ref_z,
ref_Ha=ref_Ha,
ref_sig=ref_sig,
ref_c0=ref_c0)
# Some statistics
failed = table['wHa_0'] == 0
print("Fail rate: {}/{} = {:.2f}%"
.format(len(table[failed]), len(table),
len(table[failed])/len(table)*1e2))
# table[failed].show_in_browser(jsviewer=True)
print_stats(table['dz'][~failed], table['dz_err'][~failed],
names=table['ID'][~failed], label="Redshift offset")
print_stats(table['fratio'][~failed], table['fratio_err'][~failed],
names=table['ID'][~failed], label="Flux error")
# Complex-line fit result figure
fig = fig_result(table, failed)
title = u"[NII] + Hα"
if tie_NIIHa:
title += u", tied"
fig.suptitle(title)
P.show()
|
Single-line fit
Single-line fit to s-1-*.dat spectra, with flux bounded to positive
values:
Time to fit 4356 spectra: 156.091279 s = 35.83 ms/spec
Fit result saved in output-s-1.dat
Fail rate: 161/4356 = 3.70%
Redshift offset: 4195 elements
  Mean: +0.00017    Median: +0.00009
  RMS:  +0.00262    wRMS:   +0.00036
  Min:  -0.02530 for s-1-607
  Max:  +0.02312 for s-1-1823

Flux error: 4195 elements
  Mean: +0.01703    Median: -0.00875
  RMS:  +0.30877    wRMS:   +0.04795
  Min:  -0.94139 for s-1-1276
  Max:  +3.15683 for s-1-1539
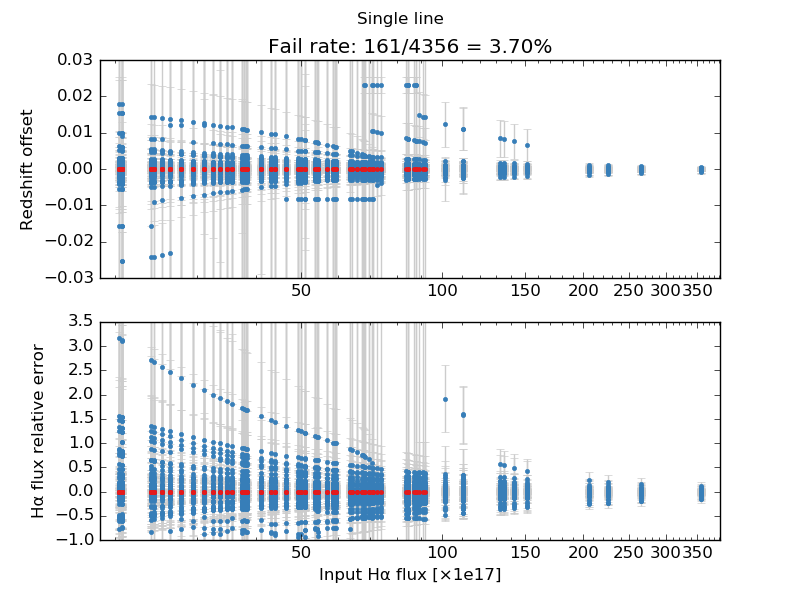
Figure: redshift offset (top) and Hα flux relative error (bottom) as function of input Hα flux, for the single-line fit. Spectra with a failed fit (convergence issue or singular covariant matrix) are marked in red.
Complex [NII]+Hα fit
Complex [NII]+Hα fit to s-2-*.dat spectra, including a constraint on
the [NII]/Hα intensity ratio and intensity bounded to positive
values:
Time to fit 4356 spectra: 488.914332 s = 112.24 ms/spec
Fit result saved in output-s-2_tied.dat
Fail rate: 135/4356 = 3.10%
Redshift offset: 4221 elements
  Mean: +0.00008    Median: +0.00004
  RMS:  +0.00210    wRMS:   +0.00151
  Min:  -0.01238 for s-2-351
  Max:  +0.02454 for s-2-797

Flux error: 4221 elements
  Mean: +0.04272    Median: +0.00896
  RMS:  +0.22717    wRMS:   +0.04380
  Min:  -0.59672 for s-2-1671
  Max:  +1.76076 for s-2-1803
![Complex [NII]+Hα fit result.](_images/output-s-2_tied.png)
Figure: same as above, for the complex [NII]+Hα fit, including a constraint on the [NII]/Hα intensity ratio.
Todo
convert to Notebook.